
Alternative Scenarios
The Reference Scenario provided insights into the mix of least-cost resources needed to meet energy demand over time with a strong focus on energy efficiency and electrification, while each alternative scenario and sensitivity changed a key aspect of the Reference Scenario and held everything else constant. This helped to isolate the impact of the change and draw out lessons learned.
Changes to scenarios and sensitivities included things like exploring lower levels of energy efficiency and/or slower rates of electrification to test the hypothesis that, based on evaluation of other studies, high levels of these in the near term would be key elements for ensuring Oregon’s energy transition is on the least-cost pathway. This hypothesis was correct. This exercise also resulted in a deeper understanding of interactions across the transportation, buildings, industrial, and electricity sectors in Oregon. It also provided valuable insights into the direction the state must take to achieve its energy policy objectives.
A key takeaway from the scenario analysis was that the alternative scenarios and sensitivities (with the exception of the lower tech load sensitivity) increased the economywide cost of meeting our energy policy objectives.
-
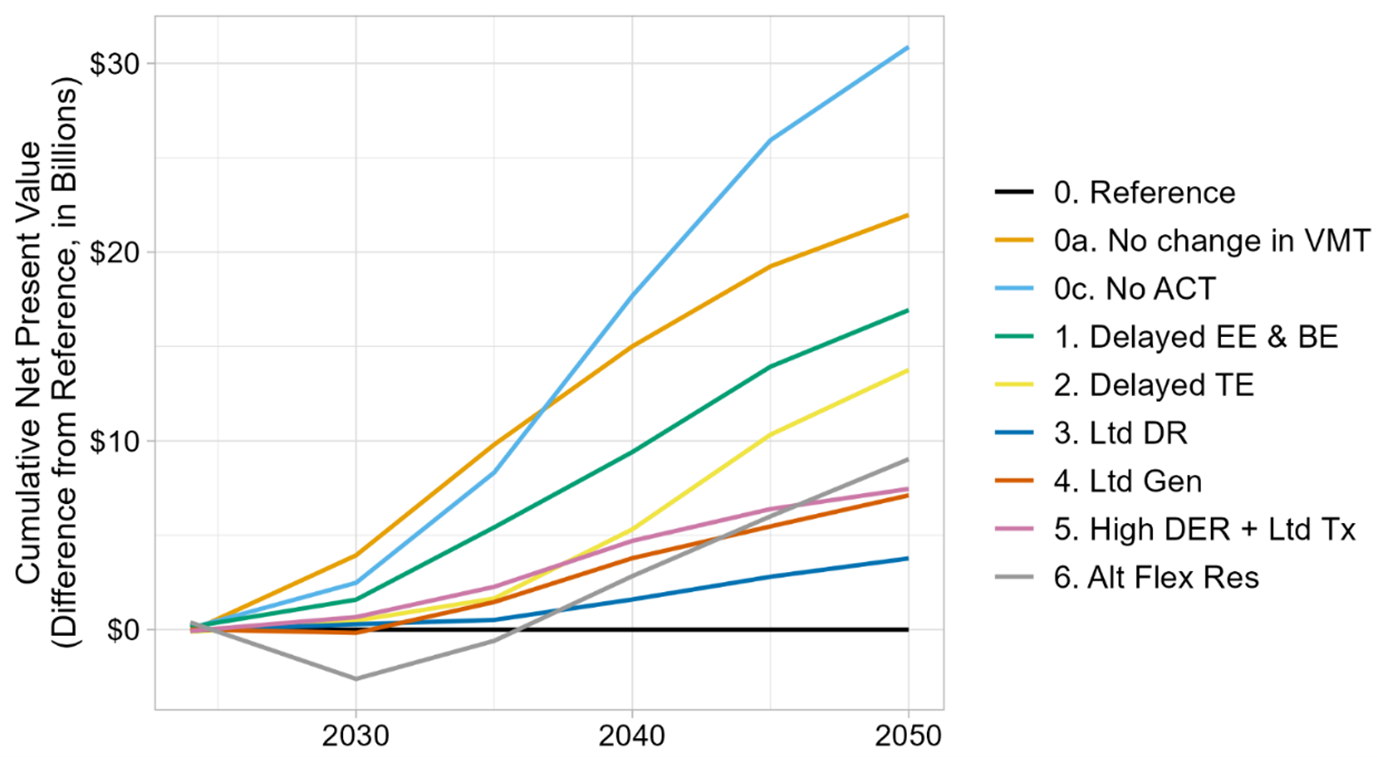
Scenarios 1-3 demonstrate the cost of delaying action on energy efficiency and building electrification (Delayed EE & BE), transportation electrification (Delayed TE), and demand response (Ltd DR). Scenario 4 demonstrates the cost of relying less on in-state generation and more on imported renewable resources (Ltd Gen), compared to the Reference, which sought the least cost combination of in-state generation and imports. Scenario 5 shows the increased cost of relying on distributed resources in a transmission-constrained situation (High DER+Ltd Tx). Scenario 6 shows the increased cost if the power system cannot rely on a combination of fossil and low-carbon gas for reliability, though notably this scenario’s increased costs are due in part to significant economic development occurring in the state to produce more low-carbon fuels (Alt Flex Res).
-
Two sensitivities led to the highest cost increases modeled. The most expensive explores the cost of not having an Advanced Clean Trucks rule (No ACT), thereby eliminating near-term electrification targets for medium- and heavy-duty vehicles. The second assumes that there is no change in per capita light-duty vehicle miles traveled by 2050 compared to today (No change in VMT). Both result in a much higher cost of economy-wide decarbonization. However, it is important to note that the modeling does not account for any investment that may be required to achieve the level of VMT reduction assumed in the Reference Scenario. Some level of investment would be necessary, including capital for infrastructure that makes alternative modes of transportation more convenient and desirable. Therefore, these results are best interpreted as providing an investment value for VMT reduction measures, rather than cost savings resulting from them.
Not pictured here is a sensitivity where only half of the tech loads from the Reference are built. The difference in costs for this scenario was not calculated, as the focus of this exercise was to understand the costs of supplying the energy needed to power the economy without limiting economic development.
-
All scenarios, including the Reference Scenario, applied a conservative approach in determining where new electricity generating resources could be sited. The analysis applied siting levels developed by The Nature Conservancy in the Power of Place West study, which were determined to be consistent with data in Oregon’s Energy Siting Assessment tool (ORESA). Siting Levels 1, 2, and 3 lands were excluded from development across Oregon. This includes legally protected, administratively protected, and high conservation value land, including tribal lands, prime farmland, and big game priority habitat and corridors among other criteria.
In 2024, wind accounted for about 97 percent of the land area hosting wind and solar development, and solar accounted for about 3 percent. Most of the solar development occurs east of the Cascades. Over time, wind continues to account for more than 90 percent of the land area for renewable energy development. While this is not a forecast, it reflects what the model found to be the level of cost-effective development of wind and solar in Oregon balanced with other resources in areas not excluded from the Power of Place categories. It provides a sense of scale and opens the door to conversations on how to align the need for renewable energy development with competing – and in certain cases, complementary – land uses.
Land area used for wind and solar power in the Reference Scenario in 2024, 2035, and 2050.

Most of the other scenarios and sensitivities resulted in a similar level of buildout of wind and solar resources in the model. More economic development, such as in Scenario 6 (Alt Flex Res), may increase the level of buildout. A few scenarios led to lower volumes of wind and solar development:
Limiting in-state generation (Ltd Gen) reduces land area needed for development by 15 percent in 2035 and 31 percent by 2050, though at a higher cost to ratepayers compared to the Reference and with reduced employment benefits in Oregon. Notably, this scenario requires more transmission to be built to make up from the lost generation through higher imports. Land area for transmission was not calculated for this modeling analysis.
Building fewer data centers (50% Data Centers) reduces land area needed for solar and wind development by 8 percent in 2035 and 15 percent in 2050 compared to the Reference. This scenario also significantly reduces the model’s selection of enhanced geothermal in 2040.
Relying more on distributed PV and limiting transmission to reconductoring (High DER + Ltd Tx) reduces some utility-scale investment, including land area needed for solar and wind development by 3 percent in 2035 and 4 percent in 2050 compared to the Reference. The main reductions are in utility-scale solar east of the Cascades and utility-scale wind west of the Cascades.
More details on the takeaways from each of the alternative scenarios are available in the detailed technical report and data library from the modeling, as well as in the key findings documents prepared for the policy working groups:
Impact of resource development on land area
One of the key questions public partners asked was how much land area might be needed to develop resources to supply reliable, affordable, clean power. While the modeling does not provide a definitive answer, it did provide a sense of scale and the factors affecting how much land area might be needed.
Before considering land area numbers, it is important to understand that significant variation may occur over the next 25 years. The amount of grid-scale solar deployed in Oregon in 2050 would be 6.73 GW in the Reference Scenario but ranges from a low of 3.95 GW in the Limited Generation scenario to a high of 13.04 GW in the Alt Flex Resources scenario. The amount of onshore wind deployed in Oregon in 2050 is somewhat less variable, ranging from a low of 6.8 GW in the Limited Generation scenario, to 9.83 GW in the Reference, to a high of 10.87 GW in the Alt Flex Resources scenario. More or less wind and solar may be deployed in Oregon, depending on electricity demand, transmission availability or constraints, technological advancements, and other factors.
Wind and solar resources have the largest land footprint of resources evaluated and were therefore selected to provide a sense of the scale that might be expected. In 2024, the total land area used for wind and solar capacity was 322 square miles, equivalent to 0.3 percent of Oregon’s land area. In the Reference case, by 2035, this increases to 627 square miles, and by 2050, to 814 square miles. This is equivalent to less than 1 percent (0.8 percent) of Oregon’s land area by 2050. The footprint of onshore wind accounts for most of this area. While the base of wind turbines has a small footprint, dedicated land area is bigger to account for the size of turbines and the need for space between them — but this land can still be used for other purposes. Solar, on the other hand, has a much smaller footprint per MW installed than wind, but more complete ground coverage and more limited land use once installed.
Siting Levels Developed by The Nature Conservancy in the Power of Place West Study
Note: shaded areas on the maps represent areas where the analysis does not allow for development to occur.